Wind is a mighty force. It moves our ocean currents, shapes the landscape and helps forge plant communities. This month, we showcase an artifact that not only gives shape to this force, but also calls attention to the rich history of citizen science that powers our country’s weather science: a vintage printed map illustrating the wind currents of the Pacific Coast.
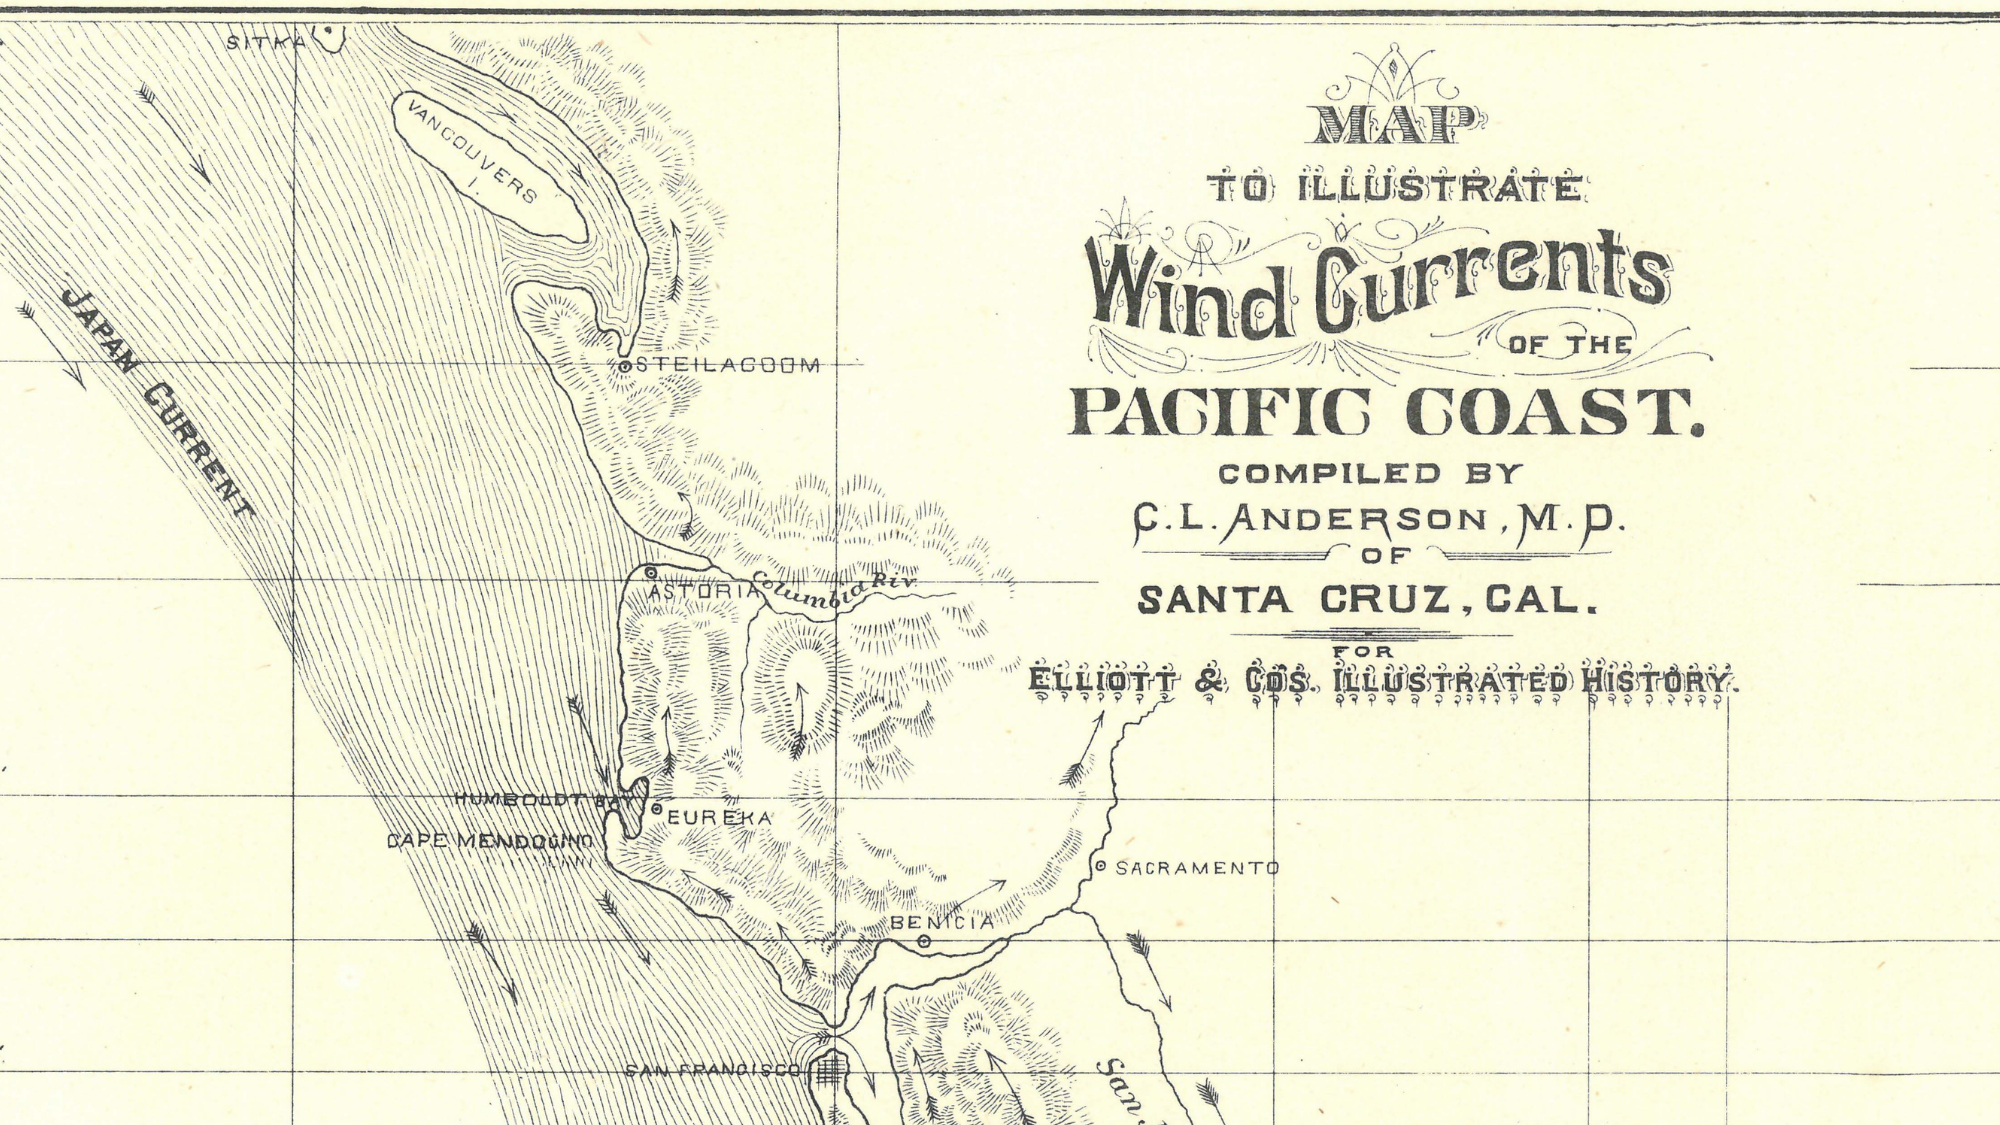
This gorgeous map, crafted with delicate linework and sharp detail, was purchased by the Museum in 1977 and originally published in 1879 in Elliott’s Illustrated History of Santa Cruz County. It depicts the wind-powered currents that batter the Pacific Coast, with Santa Cruz near its center.
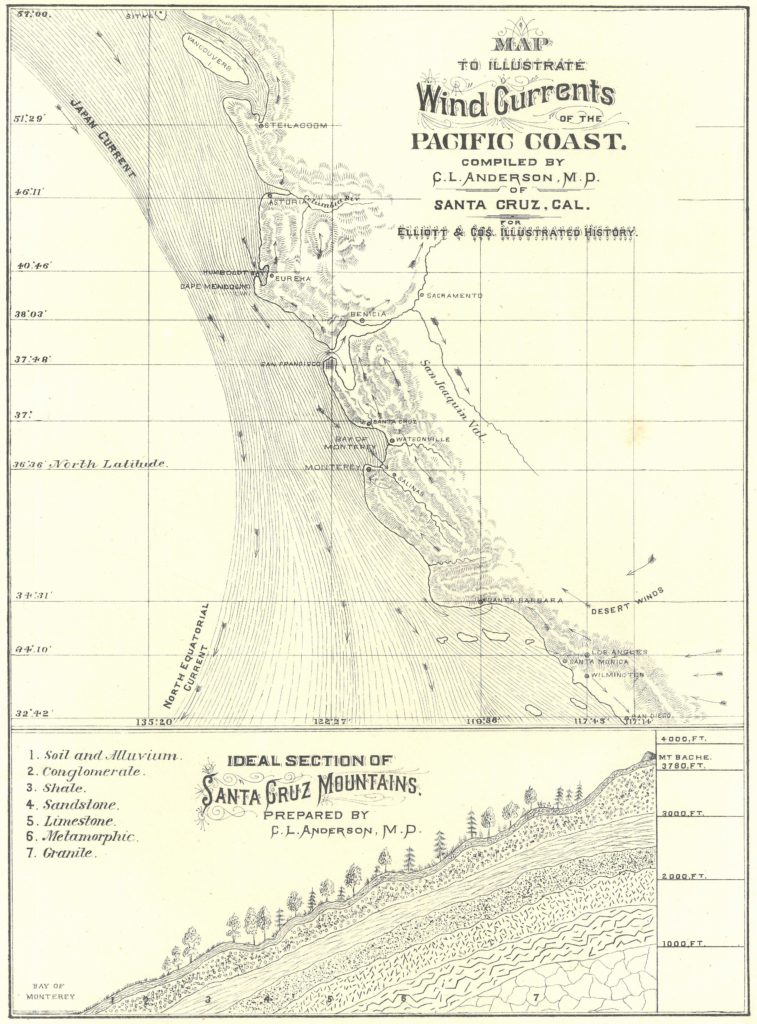
As you can probably tell, the scale of the map is shortened along the vertical axis — the author was keen to depict as many important “coast openings” as possible in the small space. An illustration toward the bottom of the map depicts idealized geological layers of the Santa Cruz Mountains.
Ocean currents are driven by a mixture of wind, water density differences and tides. The map depicts what we today refer to as the California Current: a large-scale current system that brings cool waters southward along the Pacific Coast. Simultaneously, land breezes push ocean surface waters away from the coast, which allows cooler, nutrient-filled water to rise up from ocean depths.
This process, called upwelling, supports California’s rich coastal ecosystems. For a more modern visualization, check out NASA’s Perpetual Ocean, which displays ocean current surface data from June 2005 to December 2007.
The map was compiled from U.S. Coast Survey data recorded by Dr. Charles Lewis Anderson, a local naturalist extraordinaire. On top of his day job as a medical doctor, Anderson found time to discover new plant species, became well known for his scientific publications on local natural history and even held public office. As a Santa Cruz Public Library board trustee in the early 1900s, he was instrumental in founding the “library museum” that first hosted Laura Hecox’s collection.
Anderson was struck by the interplay between winds at the border of land and sea: “When the wind blows down the coast,” he wrote in Elliott’s Illustrated History, “overlapping the land, and flowing over capes and promontories with a strong current, two or three miles inland the air is often calm and warm. Such is remarkably the case in the Santa Cruz Mountains. We may observe the white caps a mile or so out, whilst standing on some high point, scarcely a couple of miles inland, we enjoy a very mild breeze.”
One person who contributed to both our understanding of Santa Cruz weather as well as the life of the Museum was early trustee Robert Burton. In addition to his career as a high school science teacher, his collecting trips with dear friend and Museum donor Humphrey Pilkington, and his involvement in the Museum and Santa Cruz City Council, Burton was also the Santa Cruz weather station’s volunteer weather observer for over four decades.
He reported weather observations from 1931 to 1947 and 1950 to 1976. The Weather Bureau even awarded him the Thomas Jefferson Award, which denotes outstanding achievements in the field of meteorological observations. The highest honor available to volunteer observers, the award is named for Thomas Jefferson’s own decades-long meteorology career.
The length of Burton’s service represents more than just a single volunteer’s devotion to weather. It’s also part of a trend in the history of Santa Cruz weather reporting. Santa Cruz observers tended to commit for many years, and many of them lived near one another. Because Santa Cruz’s weather observations were so geographically consistent for so long, Santa Cruz is an important location for studies of long-term climate variability.
Indeed, while information provided by citizen observers continues to be essential for the daily forecast, historical data can be used to explore a future governed by changing climate. This includes projects like Old Weather, which invites members of the public to transcribe old ship logs to gather climate data, and this map that relies in part on historical data to suggest what a given American city might feel like in the late 21st century.
As we close out April, which boasted both Citizen Science Day and National Volunteer Month, we will continue acknowledging the myriad volunteer efforts that sustain not just the Museum but a great deal of scientific labor. Check out the fruits of this labor by visiting the Collections popup on display this month by the front desk, or get inspired and get involved through our volunteer options. If you’re mad for maps, check out our May 21 workshop on understanding geology through maps and illustrations.