fbpx

How a Botanical Artist Looks at a Rose with Maria Cecilia Freeman

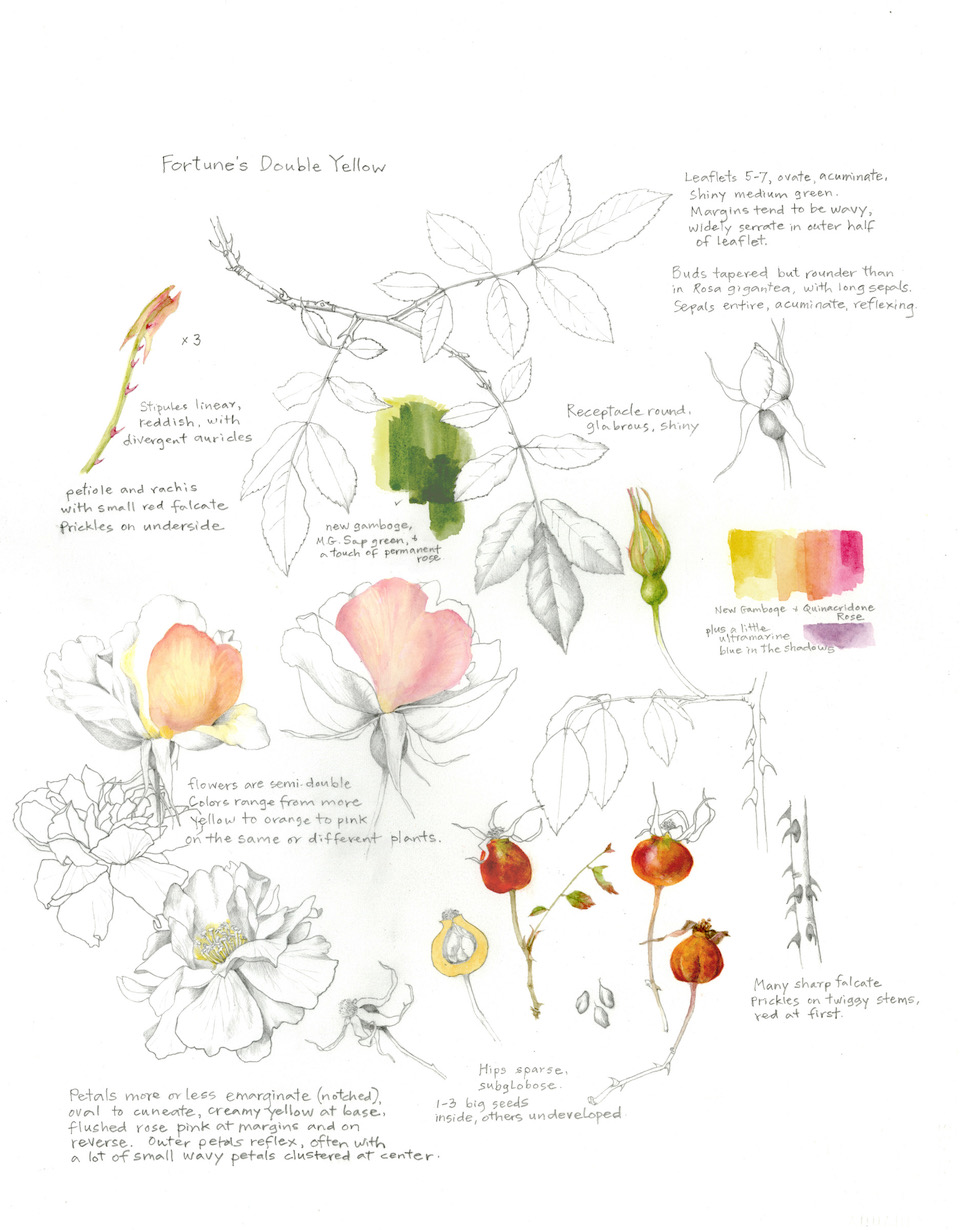
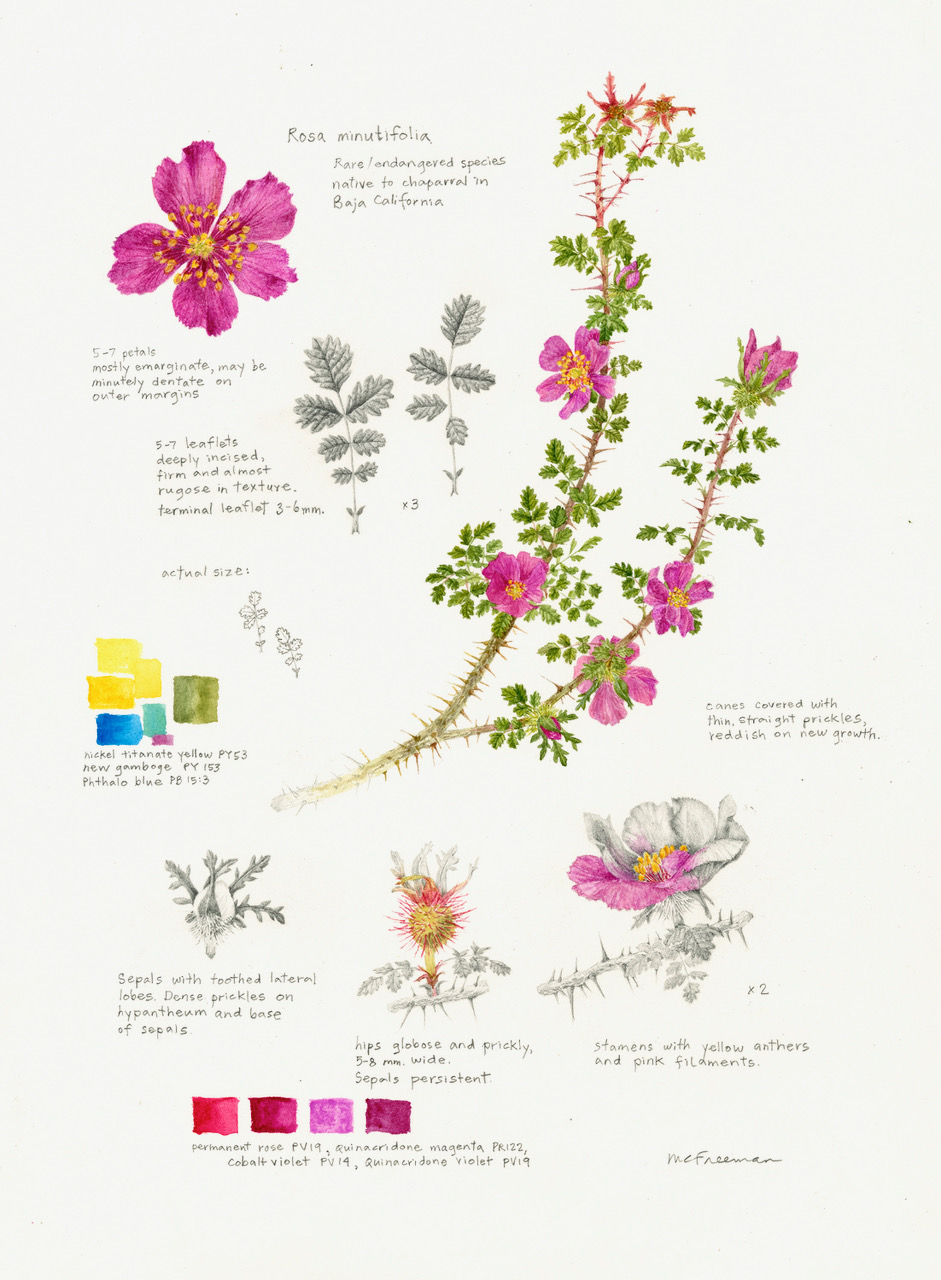
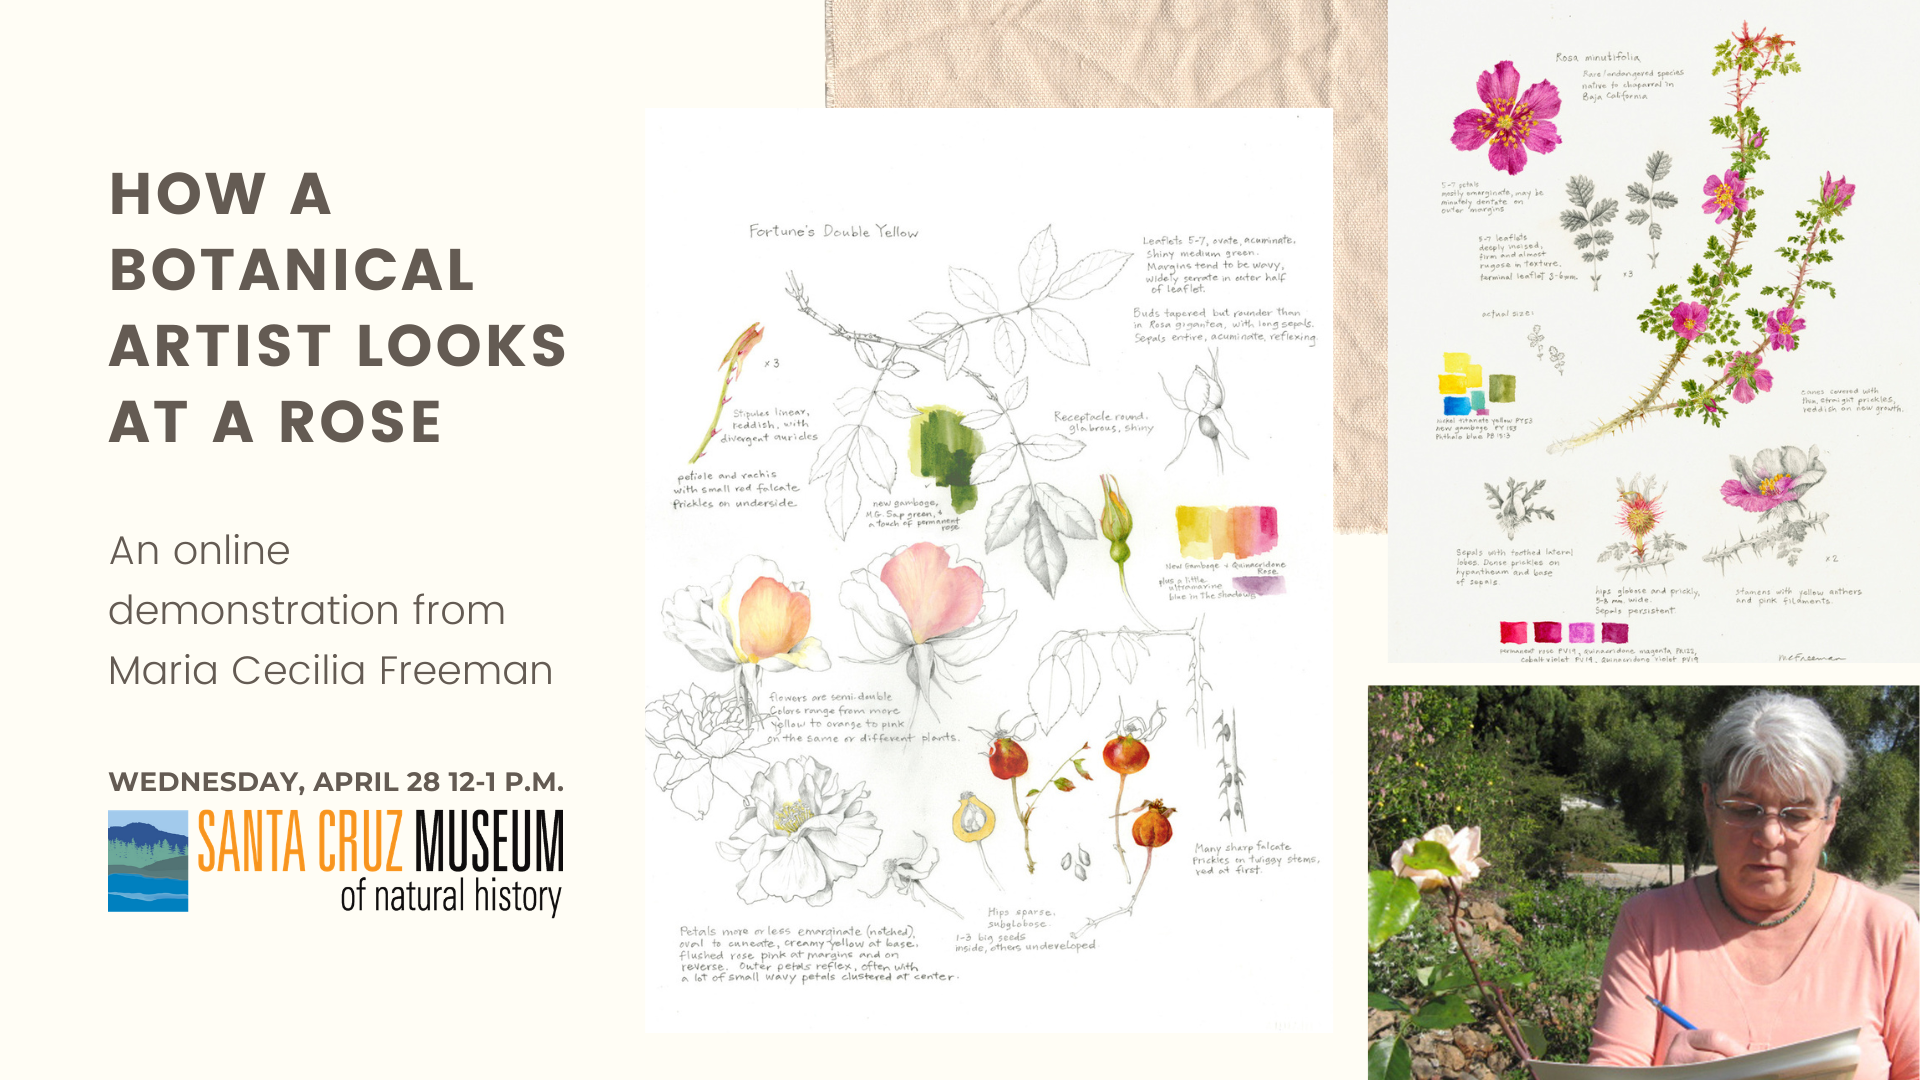
Learn how to get to know a rose in order to illustrate it. We’ll explore native and heritage roses and observe their particular characteristics. During this online lecture, Maria Cecilia Freeman will demonstrate how to draw and paint petals, leaves, and other parts that help distinguish a rose. Once you draw the identifying parts of a particular rose, you’ll recognize it wherever you see it.

This program is in support of our science illustration exhibit, The Art of Nature, on view online and in-person at the Museum.
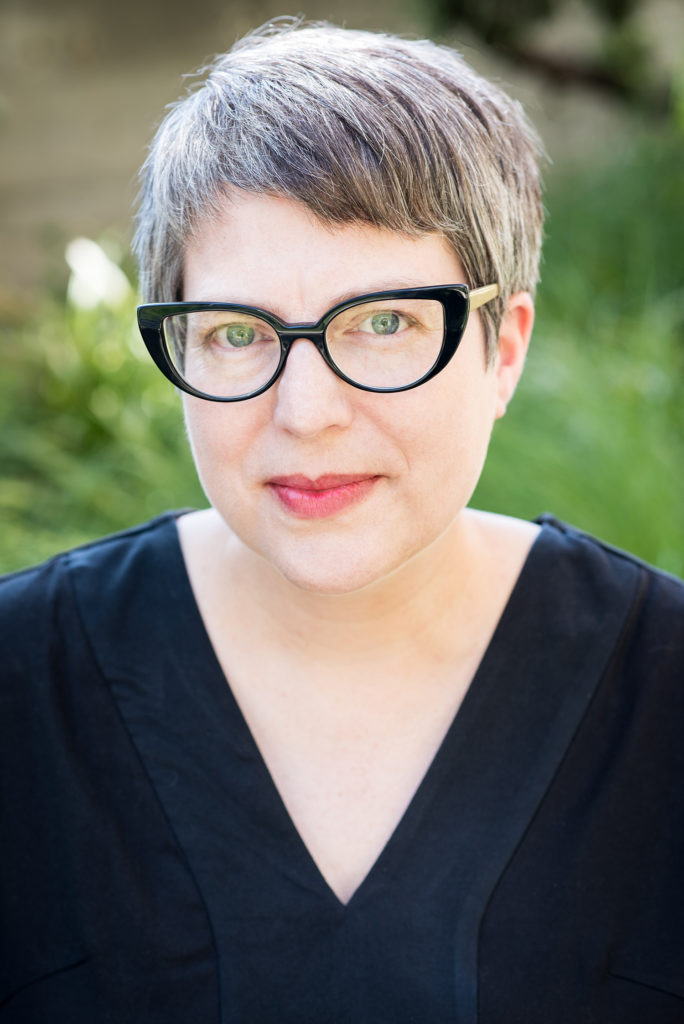
About the Artist

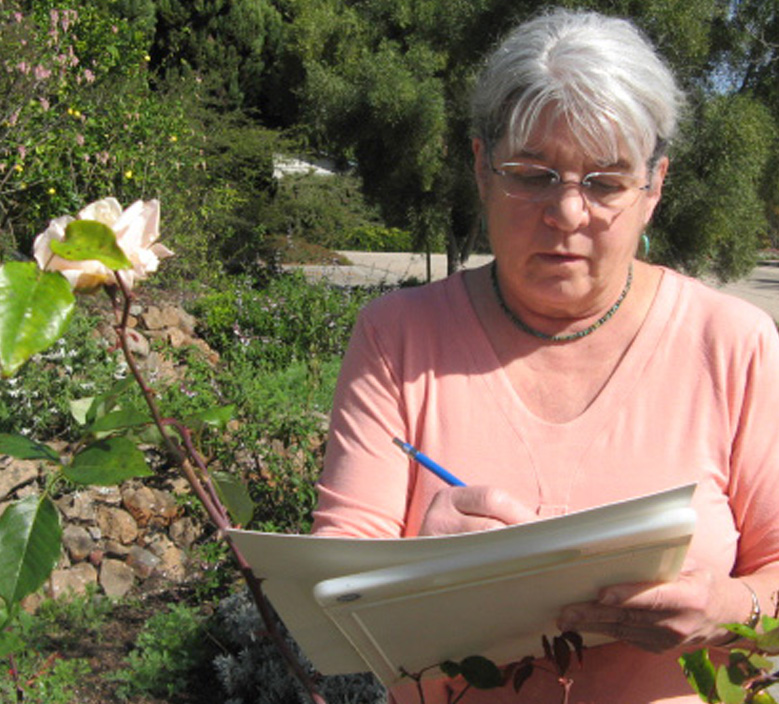
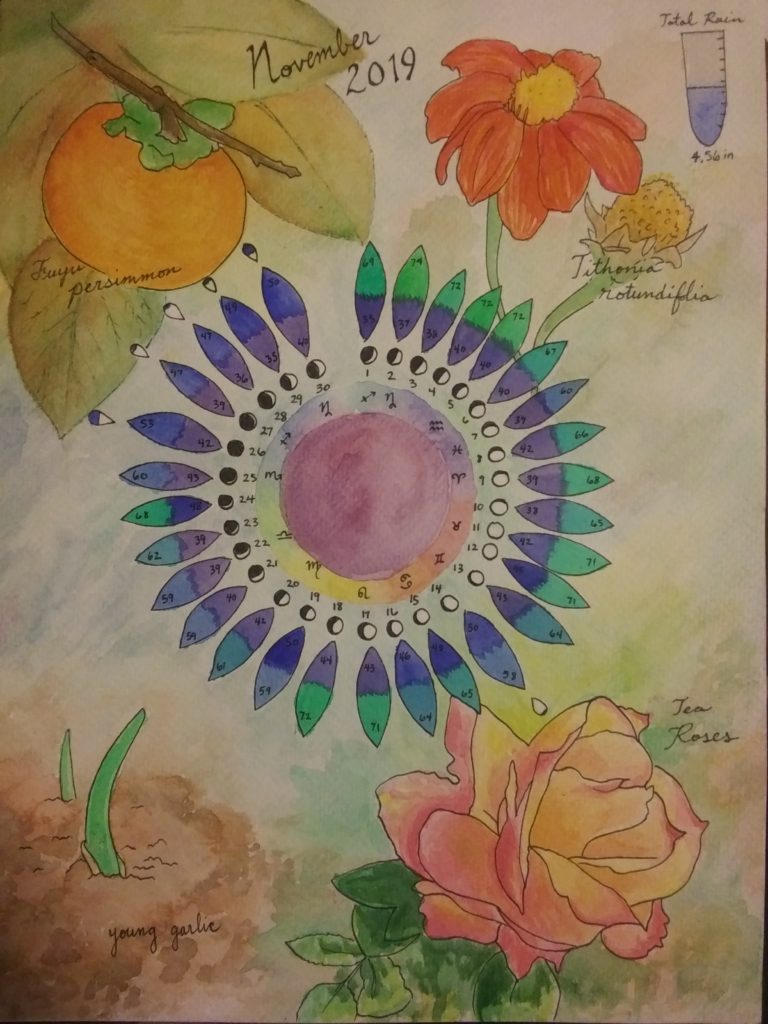
Maria Cecilia (Cissy) Freeman gardens, paints, and teaches in Aptos, where she finds or grows many of her plant subjects. Her work includes scientific illustration and botanically accurate fine art, often combining the two in graphite and watercolor studies. She takes a special interest in portraying native plant species with a view to their preservation, and she particularly loves drawing and painting heritage and species roses.

Her “Rose Studies” watercolors and drawings have appeared in solo exhibitions in Spello, Italy, at the Horticultural Society of New York, and at the San Francisco Botanical Garden. Her work has been included in juried exhibitions in the U.S. and Europe, and numerous publications. She is a member of the Northern California Society of Botanical Artists and the Guild of Natural Science Illustrators. To see her artwork, visit http://www.mcf-art.com.

The Art of Nature Events

Visualizing Science: Illustration and Beyond with Jen Christiansen

Where does illustrator end, and infographer begin? How does data visualization fit in? And what does science have to say about the design decisions we make? With the goal of strengthening connections between communities, Jen hopes to get folks thinking about what they can learn from — and teach to — different visual sub-disciplines within the broader orb of science communication.

We are excited to learn about the role of science illustration in data visualization as we continue to feature our virtual exhibition of science illustration, The Art of Nature.

Jen Christiansen, senior graphics editor at Scientific American

About the speaker: Jen Christiansen is senior graphics editor at Scientific American, where she art directs and produces illustrated information graphics and data visualizations. She completed undergraduate studies in geology and art at Smith College, then happily merged the two disciplines in the scientific illustration graduate program at UC Santa Cruz. She began her publishing career in NY at Scientific American in 1996, moved to DC to join the art department of National Geographic, spent four years as a freelance science communicator, then rejoined the SciAm team in 2007. She writes on topics ranging from reconciling her love for art and science, to her quest to learn more about the pulsar chart on Joy Division’s Unknown Pleasures album cover.

http://jenchristiansen.com/
https://blogs.scientificamerican.com/sa-visual/

Phenology Wheel Activity

All around us, things are constantly changing. Spring rains come and bring new flowers, baby birds are hatching from eggs, and new green leaves emerge on trees. Can you think of some ways you have observed changes in nature? 

Artwork by Ivy Kae from The Art of Nature Exhibit
  • Phenology is the study of cycles and patterns in nature. You can practice phenology by making observations in nature and noticing how things change over time! Create a phenology wheel of your own as a tool to record your observations about a natural phenomenon in your own life! 
  • A phenology wheel is simply a way to keep track of the observations you are making about your chosen subject in nature.
    • Here is a detailed guide for creating your own wheel.
    • Or you can use this template!
  • To use the wheel, spend some time making observations in nature for a day, week, month, or even an entire year! You can focus on one species or a special spot outside your window or place of your own choosing

Here  are some prompts to help inspire you to create your own wheel! Check out the detailed guide below for even more ideas. 

  • Look outside your window each day for a week. What do you notice? What has changed? 
  • Look up at the sky! Each night, record your observations of the moon throughout its phases on your phenology wheel.
  • What’s the weather? Track the weather where you live for a week/month/year. 
  • Do you see any animals regularly near your home? Such as a bird? What do you think it is doing?
Activity Guide: Creating Your Own Phenology Wheel (PDF | HTML)
Activity Guide: Creating Your Own Phenology Wheel (Spanish Version) (PDF)

Watch our Phenology Wheel Video.

Post by Ellen

Lecture: Exploring Science Through Art with Andrea Dingeldein

Art is essential to increasing scientific knowledge and inspiring conservation. This lecture from Andrea Dingeldein, a local artist and educator featured in the Museum’s 2020 exhibition of science illustration, The Art of Nature, explores science illustration, both historical and contemporary, and its importance as a tool to observe and connect with nature.

Andrea Dingeldein is a marine biologist, naturalist, and general lover of nature. Andrea’s focus is in marine illustration, but she enjoys drawing insects, reptiles, and any other creepy-crawlies she can get her hands on. She specializes in illustrations for peer-reviewed science articles and has published illustrations in Ecological Modeling and Bulletin of Marine Science. Other clients include NC Department of Marine Fisheries, Friday Harbor Laboratories, and Western Society of Naturalists. Explore her work.

Andrea has two pieces in our 2020 exhibition of science illustration, The Art of Nature. Explore the virtual exhibit.

Science Illustration Prompt: Sequential Observations

Explore science illustration with artists featured in our annual exhibit, The Art of Nature, and get tips for how to make your own science illustrations at home. This post is from Megan Gnekow, recipient of the Museum’s 2019 Laura Hecox Naturalist Award.

A watercolor of a bird of prey feeding a chick

I make scientific illustrations because I want to inspire folks to look closely at the world around them. I want to make complexities and relationships more clear, helping people understand that all organisms are connected to each other. — Megan Gnekow

Prompt: Sequential Observations

There are so many great ways to use a nature journaling project to connect to your local habitat(s). One of my favorites is sequential observations — making notes and sketches about an organism you observe over time. Spring is a great time to do this because there are so many visible changes happening in our environments.

Choose an organism that you can observe regularly over a period of time (the period of shelter-in-place is a good place to start!). Observe the organism you have chosen as frequently as you are able to and make notes and sketches about what you observe. Note date, time, location (macro-habitat and micro-habitat). Use as many of your senses as you can and record what you learn!

Recording your observations over time gives you insights into an organism and the environment in which it lives. Hopefully this plants a seed for further observations and exploration. Don’t worry about making beautiful drawings. Just sketch and/or note what you observe! 

If you can’t get outside or have other limitations to observing organisms, there are plenty of webcams available to inspire you — I would suggest a bird camera hosted by the Cornell Lab of Ornithology or the falcon cam at UC Berkeley.

Read more about Megan Gnekow here and visit her website here. Explore all of her illustrations from this peregrine falcon series here.